Failures (of Price Action) Can Lead to Success
Understanding the workings of price action is essential to becoming a successful trader. Investopedia defines price action as simply “the movement of a security’s price.” It goes on to explain that “no two people will analyze every bit of price action the same way, and that is why a lot of traders find the concept of price action so elusive.” Indeed, price action can be elusive if you’re not familiar with some of its basic tenets. As there are multiple aspects of price action, today we’re going to focus on one important one: failures.
Generally, people try to avoid failure, in whatever endeavor they undertake: failure is bad. But, in price action, failure is good. More precisely, when price fails to make new highs, it’s telling you it wants to go lower. Likewise, when price fails to make new lows, it’s signaling that it wants to go higher. Let’s take the following ES 60 minute chart as an example. Click the chart to enlarge it.
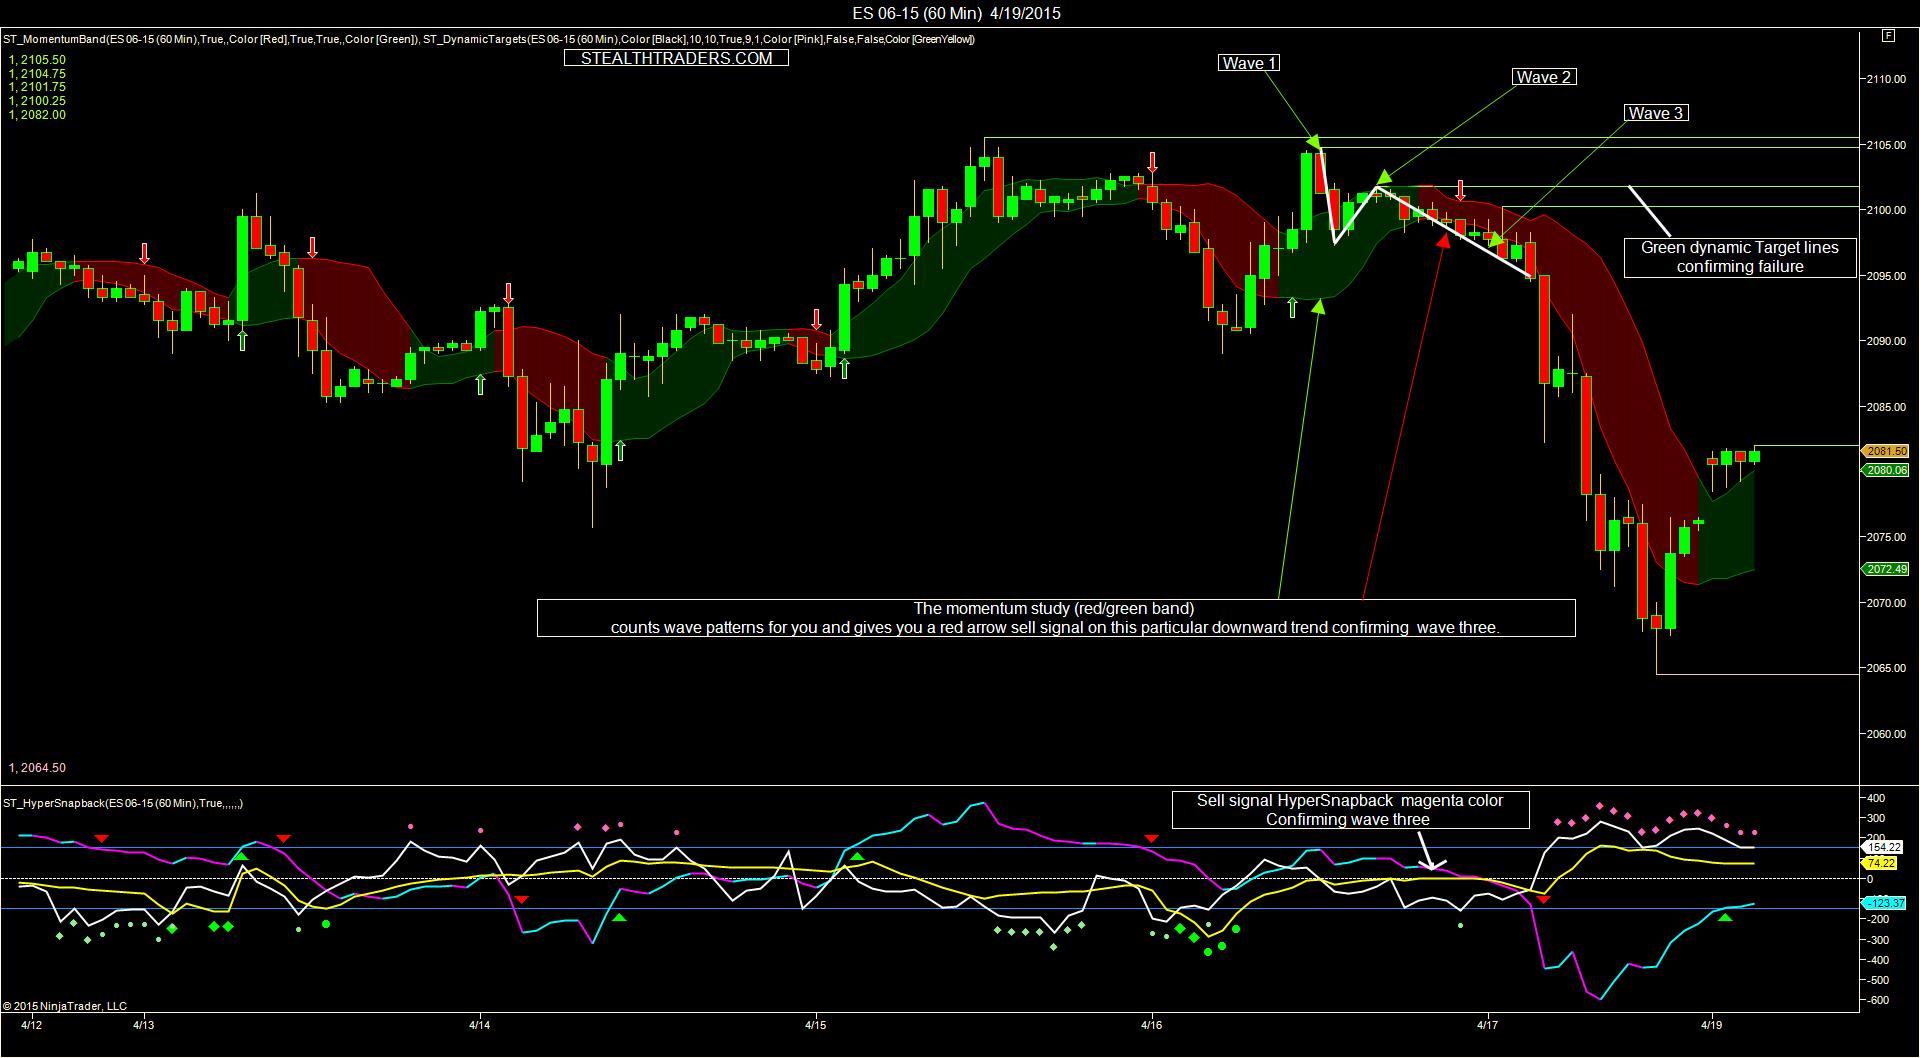
It’s necessary to utilize wave counting, another aspect of price action, to discuss failures, as both aspects of price action are intertwined. At the point indicated by Wave 1, price failed to reach the Dynamic Target line at 2105.50, the first failure. At that point, price moves downward, creating a new Dynamic Target line at 2014.75. This is the start of a wave 1 down.
Price fails to fully retrace the prior upward move, and starts going higher. This is the end if wave 1 and start of wave 2. Price does not reach the Dynamic Target line at 2104.75 set at the beginning of wave one, and starts turning downward. This is the second failure, the end of wave 2 and the start of wave 3. Price is telling us it’s thinking about going down, but it hasn’t made up its mind yet.
When price breaks below the low set at the end of wave 1, then it’s pretty sure it wants to continue down for a while. Now that we have an idea of what price is likely to do, we should confirm it with our indicators. First, the Momentum Band gives a downward arrow. Second, the trend line in the HyperSnapback indicator (along the bottom of the chart) turns magenta. Both indicate a move downwards. Thus, the indicators have confirmed the price action, and we’re ready to pull the trigger on a short entry. This is how price action failures lead to success.