How to Predict Moves With “Time and Sales” Data
“Time and Sales” data are the actual time, sale and volume of every sale of a particular financial instrument. Also included in the data is whether the sale was at the ask, bid, above the ask or below the bid. This is the key component. Because, if there are a lot of sales at or above the ask, the price will tend to go up. Conversely, if there are a lot of sales at or below the bid, the price will tend to go down. You can get a fairly accurate brief glimpse into the direction the price is tending to go.
However, during normal volume, or even low volume, there are often multiple trades per second. So as you can imagine, Time and Sales data will scroll by really quickly, rendering it nearly impossible to determine the flow of money into the market. Unfortunately, you can’t slow down time.
To solve this problem, we created the Money Velocity indicator, a visual representation of the Time and Sales data. With it, you can easily see real-time bars representing the number of sales at (and above) the ask price and the number of sales at (or below) the bid price. An additional bar shows the difference between the ask and bid sales, what we call the Money Velocity. Now, with the Time and Sales data in an easily ascertainable visual format, you will know with precision when to enter trades, and just as important, when to not enter trades.
Additionally, block trades often indicate institutional buying and selling, and are also useful in determining the velocity of money. Block trades at (or above) the ask indicate buying pressure, and block trades at (or below) the bid indicate selling pressure. The Money Velocity indicator shows the number of block trades at (or above) ask, shown above each bar, and at (or below) bid, shown below each bar.
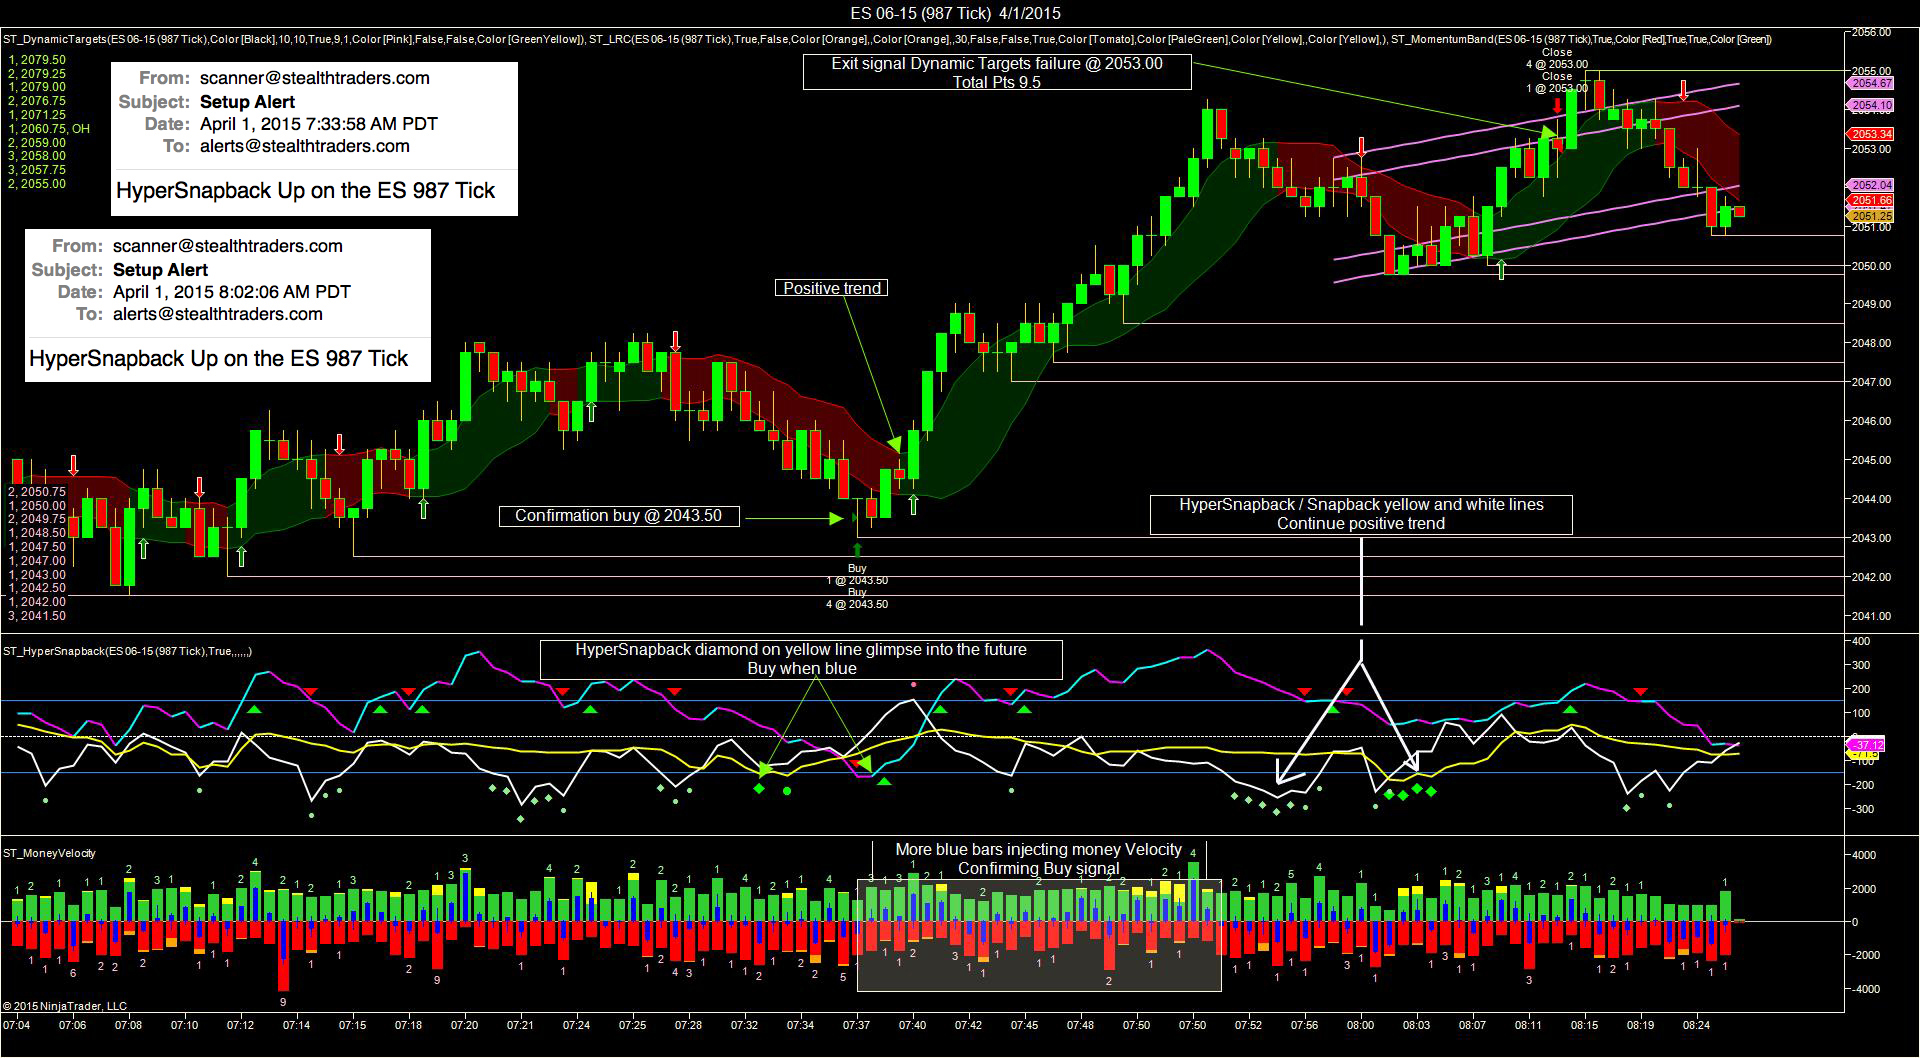
The chart below demonstrates a successful trade made yesterday in which the Money Velocity indicator (bottom of the chart) was used to confirm the entry. Click the chart to enlarge it. As you can see, at the time of the entry, money was pouring into the buy side (blue bars inside the green bars).
You should only enter a trade if the money velocity is going in the direction of your trade. Otherwise, you’re likely to get stopped out. You can’t afford to ignore the direction money is flowing.